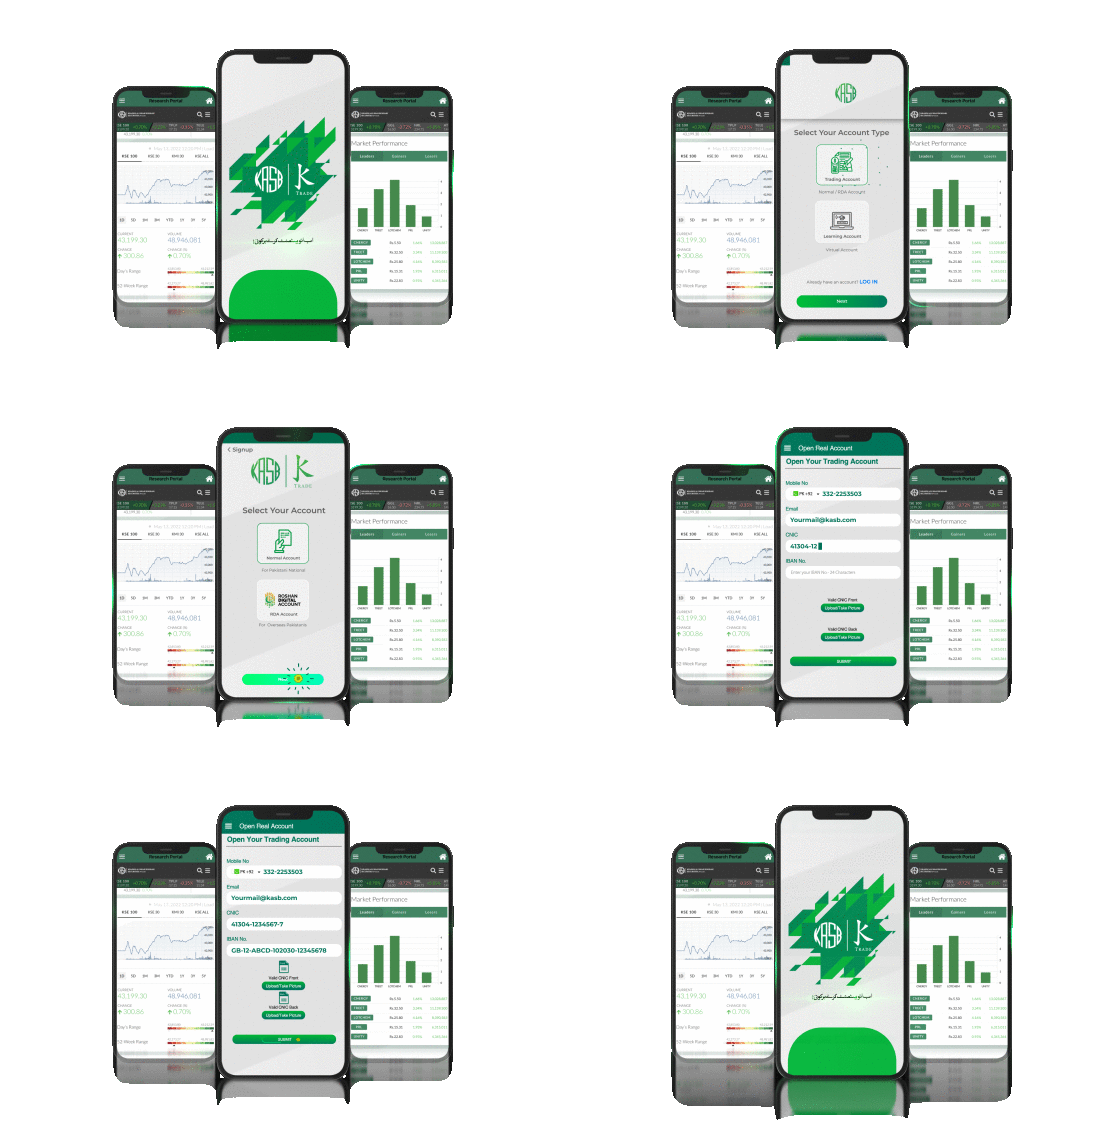
You’ve done everything – downloaded the app, deposited the money, and given all the documents. All that is left is to trade. But how would you know which stocks to buy and when to sell them?

One of the fundamental rules of investing is to buy a stock when it’s undervalued and sell it when it becomes overvalued. But how would you know how to do that? Using both fundamental and technical analysis techniques, we’ll show you how to understand these methods to help you make smarter investment choices using the KTrade Securities app.
Fundamental Analysis
Fundamental Analysis involves assessing the fair value of a stock based on the company’s ability to generate profits. To do this, consider various factors, such as the company’s performance, management, competition, and overall economic conditions. Here’s how you can approach it:

Top-Down Approach: Begin by analyzing macroeconomic factors that may impact the company. Understand how the broader economic trends could affect its performance.
Bottom-Up Approach: Focus on the company’s specific factors like its products, competition, market share, and management quality. Consider economic factors through the lens of company-specific data.
By using fundamental analysis, investors can determine whether the company is financially sound and has the potential to generate profits.
Technical Analysis
Technical Analysis, on the other hand, tracks investor sentiment by studying the stock’s price movement. This method is based on the belief that historical price patterns tend to repeat themselves. Here are the basics of technical analysis:

Line Charts: These charts show the stock’s price trend over time. An upward line indicates a bullish sentiment, while a downward line suggests a bearish sentiment.
Bar Charts: Bar charts display the opening, closing, high, and low prices for each period. They help identify trends and price ranges.
Candlestick Charts: Candlesticks show the open-to-close and high-to-low price ranges. A green candlestick indicates a price increase, while a red one signifies a price decrease.
Now, if you’re still unsure, consider joining us for our weekly webinar every Thursday, where our expert trader walks you through the technical reports of the week, and answers any questions you may have.
Putting it Together:
To make well-informed investment decisions, many investors combine both fundamental and technical analysis:
Use Fundamental Analysis: Assess the company’s financial health, performance, and potential to generate profits.
Apply Technical Analysis: Analyze the stock’s price movements to gauge investor sentiment.
Consider Both Approaches: By using both analyses, you can get a comprehensive view of the stock’s potential and decide on the right time to invest or sell.

We understand that it’s still a daunting task. But we’ve got you covered! Every week, we tell you which stocks are the best to buy and why. Watch here.
Conclusion
Evaluating stocks using fundamental and technical analysis can help average investors make informed decisions on the KTrade Securities app. By understanding the company’s financial health and investor sentiment, you can identify undervalued stocks and seize profitable opportunities. Remember, investing in the stock market involves some risk, so it’s essential to do your research and consult with a financial advisor if needed. Happy investing!


